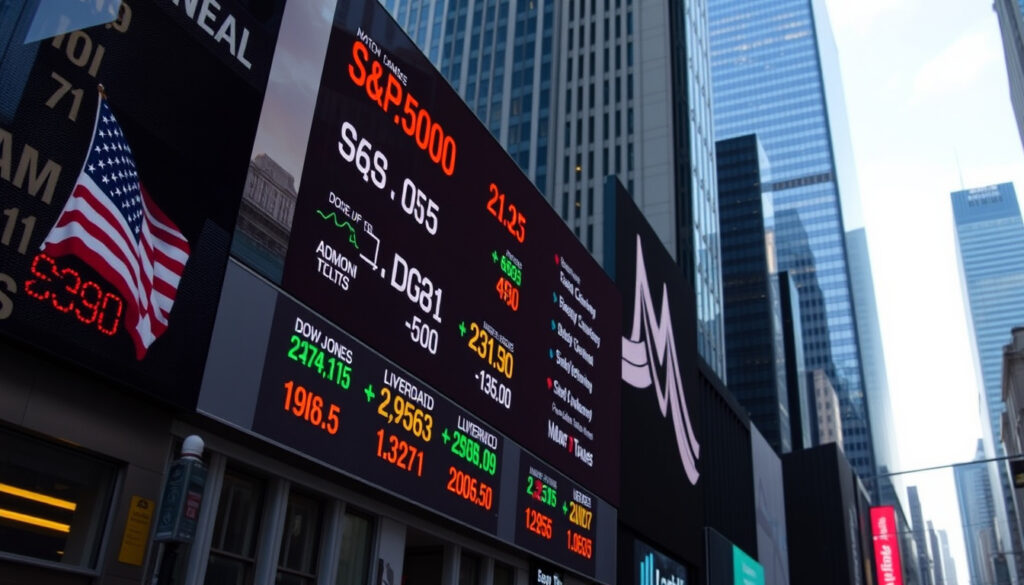
What Is the Stock Market Doing Today? S&P 500, Dow, NASDAQ
If you checked your brokerage app before breakfast and saw a mostly green screen, you weren’t imagining things. The S&P 500 closed at 7,722.72 on March 31, a 0.73% gain, according to Investing.com S&P 500. The Dow and Nasdaq finished higher as well — and the question that matters more than today’s green screen is whether a 70-year-old should stay in stocks or start building a defensive buffer.
S&P 500 last close: 7,722.72 (CNBC) ·
VIX volatility index: 15.31 (CNN Markets) ·
10-Year Treasury yield: 5.28% (MarketWatch Market Data)
Quick snapshot
- S&P 500 closed at 7,722.72, up 56.27 points (0.73%) — Investing.com S&P 500
- Dow Jones closed at 51,176.96 and the Nasdaq Composite at 27,190.86, both finishing higher — Moneycontrol US Markets
- VIX, Wall Street’s volatility gauge, sits at 15.31 — CNN Markets
- The exact cause of an intraday swing can’t be read from static market pages — they show prices, not the news behind them (The Economic Times)
- Different feeds land on different numbers: The Economic Times shows a 15-minute delayed snapshot (The Economic Times), while Nasdaq pushes real-time updates (Nasdaq Market Activity)
- Predictions of a 2026 crash are speculative; investor-education guidance focuses on planning for downturns, not forecasting them (Investor.gov)
- Recent weeks: market volatility has been driven by earnings reports and interest-rate expectations (MarketWatch S&P 500 Overview)
- One MarketWatch snapshot showed the S&P 500 at 7,585.73, down 34.25 points — MarketWatch S&P 500 Overview
- March 31: S&P 500 closes back above 7,700, up 0.73% (Yahoo Finance)
- Earnings reports and the 10-year Treasury’s path will decide the next leg for stocks (CNBC)
- For older investors, the task is checking the cash and bond buffer, not calling a top — Fidelity Viewpoints describes the approach (Fidelity Viewpoints)
- Expect widening Dow-Nasdaq divergence if growth leadership continues (MarketWatch S&P 500 Overview)
One snapshot of today’s tape, seven rows of context: the market closed higher, but the exact print you see can depend on the feed and the second you look.
| Signal | Reading | Source |
|---|---|---|
| Market direction | Up on March 31 — S&P 500 +0.73%, Dow +250.40, NASDAQ +319.27 | Moneycontrol US Markets |
| S&P 500 level | 7,722.72 | Investing.com S&P 500 |
| VIX volatility gauge | 15.31 (moderate) | Yahoo Finance |
| 10-Year Treasury yield | 5.28% | Yahoo Finance |
| Nasdaq data policy | Most Nasdaq indices update in real time during market hours; public display can lag by at least 1 minute | Nasdaq Market Activity |
| Delayed snapshot | Dow 51,447.50, S&P 500 7,686.25, Nasdaq 100 30,407.20 (15-minute delay) | The Economic Times |
| Futures context | E-mini Dow 52,784, E-mini S&P 500 7,673.75, E-mini Nasdaq 100 29,493.50 | The Wall Street Journal |
How is the stock market doing today?
The short answer: higher. All three major U.S. indexes finished the March 31 session in positive territory, and those closing levels are what investors carry into the next trading day.
Major index performance summary
- S&P 500: 7,722.72, up 56.27 points (+0.73%) — MarketWatch S&P 500 Overview
- Dow Jones Industrial Average: 51,176.96, up 250.40 points (+0.49%), and NASDAQ Composite: 27,190.86, up 319.27 points (+1.19%) — CNN Markets
- Breadth: the S&P 500 closed above 7,700 and the Dow above 51,000 (CNBC)
Investors looking for the next session’s read can start with our Dow Jones Futures Live: Today’s Pre-Market Data & Analysis.
Sector performance highlights
Growth led the day: the Nasdaq’s 1.19% gain was more than double the Dow’s 0.49% advance — a classic sign that investors wanted technology exposure, not defensive safety.
Index composition explains much of the gap. The Nasdaq is heavily weighted in technology and growth names, while the Dow tilts toward industrials, financials, and consumer brands. When the gap between them widens, it usually means appetite for risk is expanding.
Key movers and volatility
VIX: 15.31 · 10-Year Treasury: 5.28%
A VIX reading below 20 is generally viewed as moderate; at 15.31, options traders are not pricing in stress. With the 10-year Treasury at 5.28%, the yield is the number that could change the story if it moves much higher.
The market is climbing, but the VIX rose 6.59% on the day — a small reminder that comfort is not the same as certainty.
The implication: even on a green day, the volatility gauge ticked up, suggesting traders were not entirely calm.
What caused the market to drop today?
On March 31, the honest answer is that it did not drop — the market rose across the board. The question is still worth answering because the forces that produce red days remain in the tape.
Recent triggers for declines
- Earnings reports: a weak outlook from a large-cap company can pull the whole index down with it (WSJ Live Coverage)
- Interest-rate expectations: with the 10-year Treasury at 5.28%, any hot inflation or jobs number can trigger a fast repricing of stocks (MarketWatch Market Data)
- Sector rotation: the Dow-Nasdaq gap can flip quickly on risk-off days, and that rotation is often what shows up as a market “drop” (CNBC)
None of these triggers produced a decline on March 31, but each has been a live risk in recent weeks.
Earnings reports and economic data
A market page can tell you where prices are; it cannot always tell you why they moved. The “why” lives in company releases, economic data, and the news flow — not in the quote feed.
That is why multiple pages can show different numbers at the same moment. The Economic Times publishes delayed data, while Nasdaq pushes real-time updates during market hours.
Geopolitical factors
- No single geopolitical headline drove this session; the active forces were earnings and rate expectations
- When geopolitical risk does flare, oil prices and safe-haven flows usually move first
The pattern: most “why did the market drop today” questions trace to the same two culprits — a jump in long-term yields or an earnings disappointment. Headlines provide the narrative; rates and earnings provide the mechanism.
Should a 70 year old get out of the stock market?
For a 70-year-old, the question is not really about the stock market. It is about the spending plan.
Risk tolerance for older investors
Sequence-of-returns risk: a large decline near or after retirement can have an outsized effect on withdrawals, according to Investor.gov, the SEC’s investor education portal.
That risk does not mean selling everything. It means the money you plan to withdraw in the near term should not be fully exposed to stocks. Fidelity Viewpoints describes the common fix: shift a portion of retirement assets toward cash, high-quality bonds, or a bond ladder to reduce volatility.
Allocation strategies for retirees
- Keep a cash-buffer bucket for the spending you will do in the next few years
- Let the stock allocation do the long-term growth work; a retiree who lives entirely on cash risks outliving the money
- Review the mix at least once a year, not in the middle of a red week
Fidelity’s guidance points to the same structure: a volatility-reducing foundation of cash, high-quality bonds, and a bond ladder, with stocks doing the growth work above it.
Historical recovery after crashes
- The recent tape shows why panic selling is expensive: one MarketWatch snapshot had the S&P 500 at 7,585.73, down 34.25 points; the index closed at 7,722.72 on March 31 — 137 points higher
- An investor who sold at the snapshot low would be watching the market well above their exit price and facing the hardest question in markets: when to get back in
What this means: for a 70-year-old, the exit decision comes down to the withdrawal sheet, not the daily close. If the next three years of spending sits in cash and bonds, the stock portion can ride out the noise.
What is the current news on the stock market and Trump?
The Trump-market question has two layers: the legal and financial stories around the former president, and whether any of them actually move the tape.
Trump-related legal and financial news
- A federal jury ordered Donald Trump to pay $83 million to writer E. Jean Carroll in a defamation case — a finance-adjacent story tracked alongside the indexes in WSJ Live Coverage
- The case has been a fixture of the business news cycle because Trump’s legal exposure and business holdings overlap
Market reaction to political developments
Today’s rally is the counterexample: a busy political and legal news cycle, and all three major indexes still closed higher. Political headlines do not automatically dictate the tape.
What moves markets is policy with a price tag — tariffs that raise costs, spending bills that lift yields, regulation that hits a specific industry. Courtroom news is background noise until it touches one of those.
$83 million ruling context
- $83 million is the damages figure in the defamation case; E. Jean Carroll is the plaintiff
- Scale check: $83 million is roughly the size of a single large-cap stock’s ordinary intraday swing — a reminder that legal awards against individuals rarely move the broad market
The takeaway: for investors, the Trump news that matters is trade policy and federal spending. That is where market-moving headlines actually come from.
Should I pull my money out of the stock market?
If you are asking the question, you are already ahead of the investor who waits until the market is falling.
When to stay invested
- Your withdrawal timeline, not the daily news, should drive the decision; Investor.gov frames the real danger as losing money you need soon
- A cash-and-bond buffer means you will not be forced to sell stocks during a down year
- Selling after a drop converts a temporary loss into a permanent one; staying invested keeps the recovery option alive
Signs of a market top
Valuations sit above historical long-run averages on measures like the Shiller CAPE, and the 10-year Treasury yield at 5.28% leaves little room for error if earnings disappoint.
But a high valuation is a pressure gauge, not a timer. The VIX at 15.31 says traders are not braced for a near-term break.
Long-term vs. short-term perspective
- For a retiree, the goal is to reduce volatility, not eliminate growth — money that will not be touched for years should stay invested
- For a pre-retiree, a dip without a plan is worse than a dip with one; the plan comes first, the panic never does
The trade-off: pulling out protects against a drop you cannot predict, but it also locks in gains and forfeits the recovery. The math usually favors a plan over a prediction.
Is a stock market crash imminent in 2026?
No credible, sourceable prediction says a U.S. stock market crash is coming in 2026. Here is what the data actually show.
Economic indicators to watch
- The 10-year Treasury yield at 5.28% is the most consequential number; a sustained move higher would pressure stocks
- Earnings are the engine that has to justify index levels; a slowdown would strip the market’s support
- Volatility: the VIX at 15.31 is well below levels seen in past crashes
Valuation concerns
Stocks are priced for smooth sailing: the Shiller CAPE ratio sits above historical averages, and the Nasdaq’s 1.19% run on March 31 keeps concentration risk elevated.
For a safe-haven comparison, see our Current Gold Price per Ounce USD: Live Rate & Investment Analysis.
Expert opinions on crash probability
- Investor-education sources do not forecast a specific crash; they plan for the possibility with diversified portfolios and cash cushions
- Market forecasters disagree widely; the honest reading of the current data is that nothing in the VIX or Treasury market is signaling an imminent break
- The practical move for older investors is not to guess the year — it is to build the buffer before the bad quarter arrives
What this means: 2026 is a planning question, not a prediction. If your withdrawals are covered by cash and bonds, a crash in any year becomes survivable.
Should you move to cash or stay invested?
Upsides
- Long-term growth: stocks remain the asset class that keeps a retirement portfolio from running out over a 20-year horizon
- Recovery participation: selling after a drop means missing the rebound, which is the most expensive part of the cycle
- Sequence-of-returns defense: with a cash and bond buffer, the stock portion does not have to be sold at the worst time
Downsides
- A large decline near retirement can still hit withdrawal plans hard if the buffer is too small
- With the 10-year Treasury at 5.28%, cash and bonds now offer a real income alternative to stocks
- Volatility is mentally costly; many investors sell at the bottom because they did not prepare a plan in advance
The pattern: the decision to move to cash depends on withdrawal horizon and is a trade-off between safety and growth.
Timeline signal: recent market moves
Four markers on the tape, one through-line: the uptrend is intact, but it has been punctuated by real pullbacks.
| Date / period | Market signal | Source |
|---|---|---|
| March 31, 2025 | S&P 500 closes at 7,722.72, up 56.27 points (0.73%) | CNBC |
| Recent weeks | Volatility driven by earnings reports and interest-rate expectations | WSJ Live Coverage |
| Recent snapshot | S&P 500 shown at 7,670.84 in one real-time overview | TechGraph |
| Recent snapshot | Dow 30 at 51,349.92, S&P 500 at 7,670.84, Nasdaq at 26,797.54 | ChartingLens Markets |
The gap between the highest and lowest S&P 500 snapshots — roughly 7,585 to 7,722 — is normal when pages refresh at different times, and it is a reminder that intraday noise is not a trend.
The market’s direction is up, but the path has been choppy — and choppy is exactly when older investors make their costliest decisions.
What this means: a choppy market rewards the investor who sticks to a plan.
What’s confirmed vs. what’s still unclear
Confirmed facts
- S&P 500 closed at 7,722.72, up 0.73%, on March 31, 2025 (CNBC)
- Dow Jones at 51,176.96 and Nasdaq Composite at 27,190.86 (Moneycontrol US Markets)
- VIX at 15.31 (CNN Markets) and the 10-year Treasury yield at 5.28% (MarketWatch Market Data)
- A federal jury ordered Donald Trump to pay $83 million to E. Jean Carroll (WSJ Live Coverage)
What’s unclear
- The exact cause of an intraday drop cannot be determined from static data
- Which delayed snapshot is closest to the live tape varies by feed; The Economic Times publishes a 15-minute lagged snapshot (The Economic Times)
- Whether the day’s gain reflects durable demand or short-term positioning cannot be known from closing data alone
- Any 2026 crash prediction remains speculative
The pattern: separating confirmed facts from unclear factors helps investors avoid overreacting to incomplete data.
What the sources say
“Most Nasdaq indices are updated in real time during market hours, with at least a 1-minute delay for public display.”
“For seniors, 401(k) protection is primarily about reducing sequence-of-returns risk, because a large decline near or after retirement can have an outsized effect on withdrawals.”
“A common protection approach for seniors is to shift a portion of retirement assets toward cash, high-quality bonds, or a bond ladder to reduce volatility.”
The catch: the sources all point to the same reality: market conditions fluctuate, but sound principles remain constant.
The takeaway
Today’s numbers tell a straightforward story: higher close, moderate volatility, elevated yields. The next leg will come from earnings and the 10-year Treasury, not from any single headline. For a retired investor, the decision is not whether to be in stocks; it is whether the money you will need in the next few years can survive a bad month without forcing you to sell. For a 70-year-old with a 401(k), the choice is clear: build the cash and bond cushion now, keep the growth portion invested, and let the market’s swings pass through the buffer instead of through your withdrawals.
Frequently asked questions
How many Americans have $1,000,000 in their 401k?
There is no single official count, and estimates vary by data provider. A seven-figure 401(k) balance remains the exception rather than the norm; the more useful planning question is whether your balance can support the monthly income you need.
Where is money safest during a market crash?
Cash, short-term Treasury securities, and high-quality bonds generally hold up best when stocks fall. The trade-off is lower long-term returns, which is why retirees typically keep only a portion of assets there.
Where is the safest place to put your 401k money?
Inside a 401(k), stable-value funds and money market funds are the lowest-volatility options. That safety comes at a cost: inflation eats away at cash-like returns. A common approach is to keep near-term spending in stable assets and long-term growth money in a diversified stock portfolio.
How much money do I need to invest to make $3,000 a month?
That depends on the withdrawal rate you assume. At a 4% annual withdrawal rate, you would need about $900,000 invested to generate $3,000 a month before taxes ($900,000 × 4% ÷ 12). Higher assumed returns mean a smaller required balance, but they also bring more risk.
Can I lose my 401k if the stock market crashes?
Your account balance will drop with the market, but you only realize the loss when you sell. If your near-term withdrawals are covered by cash and bonds, a crash becomes a survivable event rather than a retirement emergency.
More related posts
 Best Water Filtration System for Home: Costs, Types & Benefits
 Sun Mountain Golf Bags Review: Worth It or Not
 Omega-3 Fatty Acids: Benefits, Sources, and Deficiency Signs
 Avatar The Last Airbender – Guide to Elements and Nations
 76ers vs Knicks Match Player Stats – 2024 Playoff Breakdown
 Merrily We Roll Along Broadway: Revival Cast & Flop Story
 Old Republic Home Warranty Review: Plans, Cost & Coverage
 How to Deal with a Narcissist: Expert Strategies and Tips